 Currently, two of the top eight orchestras with the highest base musician annual salary are negotiating new collective bargaining agreements: National Symphony and Philadelphia Orchestra. Interestingly enough, both of these ensembles are in positions where the outcome of those negotiations will likely have a larger impact on their future competitiveness than some of the upcoming negotiations for their peers.
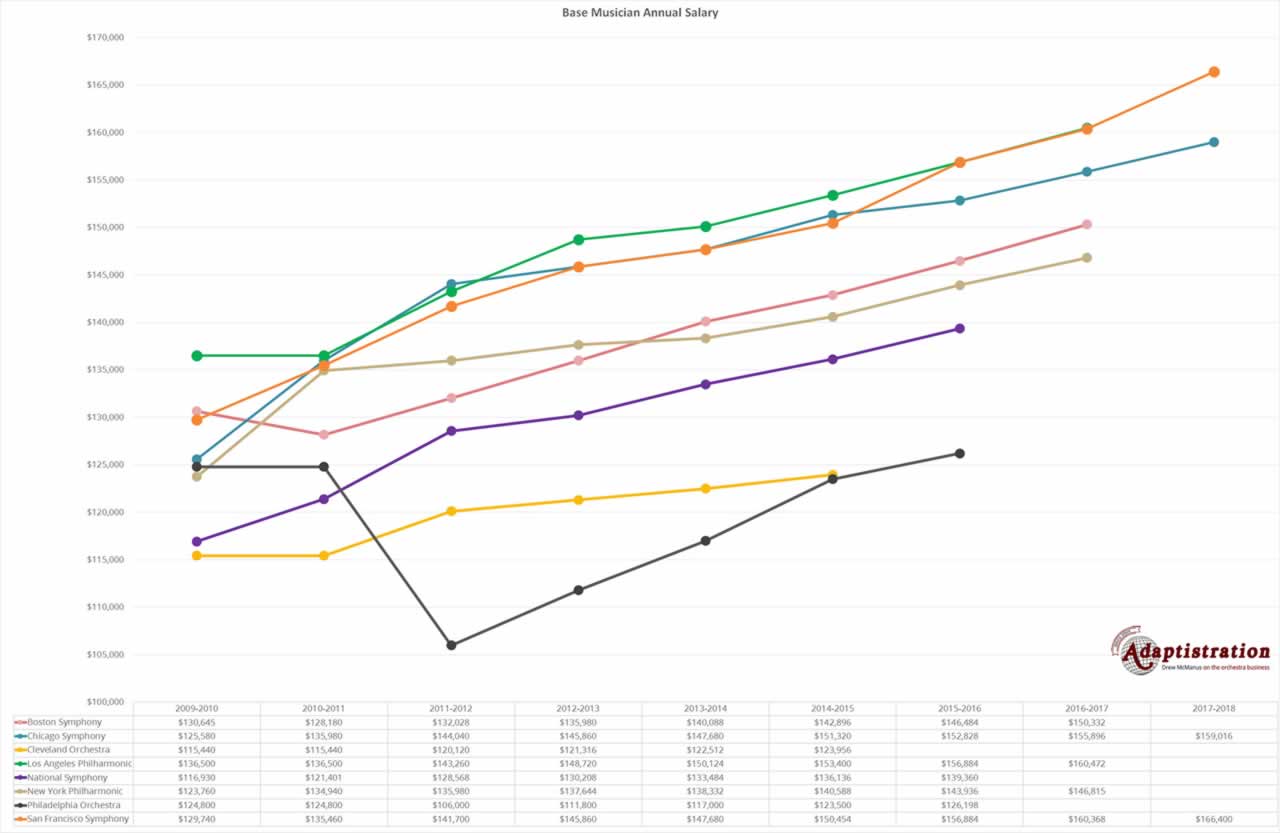
In order to visualize these distinctions, here’s a chart illustrating the current “Big Eight” base musician annual salaries from the 2009/10 season through those with agreements reaching out to the 2017/18 season.
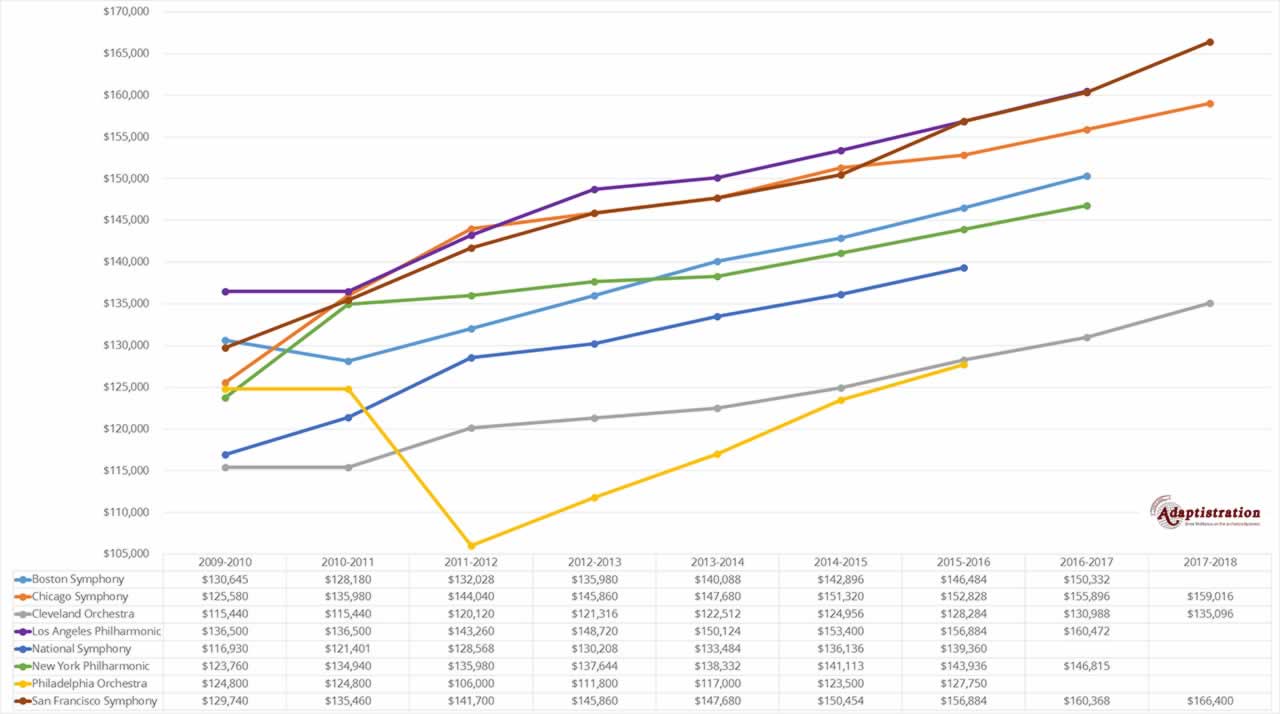
Over the past few seasons, these groups have begun to solidify three distinct compensation tiers. Let’s tighten the chart up by setting the initial year to the 2014/15 season in order to get a better look.
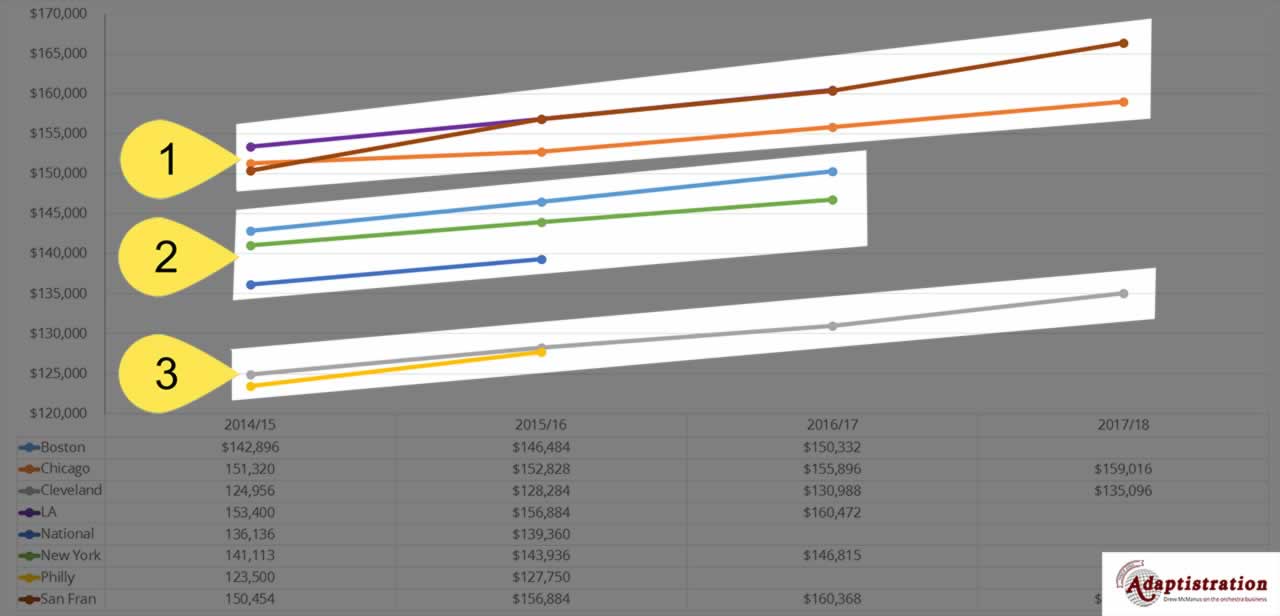
- Tier 1: The CSO, LAPhil, and SFS comprise tier one although by the end of the 2017/18 season, the latter two have firmly pulled away from the CSO. It will be interesting to see if the CSO can catch up or if they become part of Tier 2.
- Tier 2: The BSO, NYPhil, and NSO comprise tier two although the former two ensembles have managed to stay well ahead of the NSO to a point where the latter organization will need to see the sort of leap-frog level increase SFS put into place between the 21014/15 and 2015/16 seasons in order to remain competitive in this tier.
- Their 3: The Cleveland and Philadelphia Orchestras are both firmly entrenched in the bottom tier. Cleveland Orchestra currently maintains one of the longer agreements and their planned increases nearly parallel those at the very top of the pay scale. Having said that, the gap is slowly growing. During the 2014/15 season, there was a $28,446 difference between Cleveland and LA Phil and that gap increases a bit to $31,304 in the 2017/18 season. The only difference is the top spot will be occupied by San Francisco unless LA Phil manages to edge them out when they negotiate an agreement to replace the one expiring at the end of the 2016/17 season.
National Symphony and Philadelphia Orchestra At The Crossroads
 Based on what has been reported via the Philadelphia Orchestra negotiations, it seems as though the employer will be satisfied with a new agreement that not only keeps the orchestra in Tier 3 but continue to maintain lowest base musician annual compensation of the entire group.
The NSO is intriguing in a different way due to being in a unique position with three potential outcomes: close their existing gap, parallel NY Phil and BSO compensation levels, or fall back into Tier 3.
In order to see just how close of margins exist, take a look at the existing compensation gaps with their nearest neighbors.
During the 2015/16 season, NSO base musician annual salary was $4,500 below NY Phil and $11,000 above Cleveland Orchestra. However, if their new agreement produces something as seemingly innocuous as a wage freeze, they will be a marginally equal distance between those groups ($8,300 from NYP and $7,455 from Cleveland). If the new agreement contains any concessions, they would move back down to Tier 3 territory.
Related Posts
-
Now that Cleveland has settled, we can begin to get a sense for how base musician compensation compares across the highest tier of big…
-
Most professional orchestra collective bargaining agreements expire during the summer months and since the economic downturn, it is increasingly common to see groups continue…

-
The 1/24/2017 edition of the Wall Street journal published an article by Charles Passy that examines the decision by New York Philharmonic president Matthew VanBesien…

In real terms, this may be a comparison, but in real life, other items come into play such as cost of living, work opportunities beyond the job, opportunities for spouses, quality of life, etc. So this type of analysis leaves quite a few blanks in terms of how musicians may make decisions and what the true value of the job is. Having visited all three locations frequently (WA,NYC, and CLE) I know where I would want to live for what the job pays. Dileep
Certainly, base salary is a starting point for determining competitiveness and interestingly enough, both employer and employees tend to shy away from actual dollar values for those additional variables. Just look at how many employers wrap up compensation in averages while simultaneously resisting a line-item examination.
Likewise, employees will actively turn a blind eye to items that damage comparative value.
When performing valuations, I would recommend avoiding introducing variables that confuse competitiveness to personal valuation (such as the opportunities for a spouse item you referenced). Although it may be meaningful for an individual, it falls outside conditions the employer can influence. At the same time, that is a worthwhile examination, but it is mutually exclusive from competitiveness.
Musically the gaps are also tightening. A great conductor at any of these places has at their fingertips musical powerhouses. So even if orchestra A is below orchestra B in a list like this, when any of them are pushed to their highest potential their spot in the list doesn’t really matter. The quality of the conducting makes a bigger difference. Something I’ve noticed listening to a lot of them (live) is on many occasions a higher up orchestra on this list didn’t (or should I say couldn’t) play at the level of one lower down because the conductor wasn’t being as clear (and everything that falls under that). Of course being a musical powerhouse comes at the price the above are paying – it must attract the best talent – but the musical result requires the competent conductor, and the music which allows that talent to be fully realized.
Those are interesting observations. Although there is seemingly no end to discussions on something subjective like artistic quality, one item I notice that has as much if not more impact on artistic standards than the music director are key musicians. An ensemble with strong leaders and solid section members can weather a mediocre conductor but when a key musician becomes a dysfunctional member (both artistically and non-artistically), it is far more noticeable.
Moreover, detrimental effects can be felt even when key musicians aren’t bringing their A-game. These musicians tend to provide a ripple effect that makes colleagues stay sharp and even play better than they would otherwise. Ideally, the end result is something that is greater than the sum of its parts and increasingly, those extend beyond artistic expertise and into traditional leadership qualities.
Dear Drew, thank you for this blows post, graph, and analysis. Perhaps I’m asking too general a question, but what are the key determinants of relative pay in these orchestras? Population of the metro area, number of years in existence, Historical economic health of the organization, blue state vs. red state, etc. Are there reliable markers to track, or even predict what an orchestra’s quality of life factor might be? Thank you.
Hi Rob, those are all good questions to ask and it would be wonderful if each group invested in measuring those elements and more in a transparent fashion. If so, it would be possible to reach the sort of reliable comparisons I think you’re asking about (but correct me if I’m wrong there).
Having said that, that shouldn’t prevent anyone from tracking what is known but it would require a good bit of manual data mining. Combing through the collective bargaining agreements and tracking items that have continuously changing valuations such as healthcare and pension benefits would be no small task (but doable).
It would be wonderful if the field as a whole began focusing on these broader benchmarks. Ultimately, it would help produce “a rising tide lifts all boats” outcomes.
oops my autocorrect changed blog, to blows — sorry!
I don’t know, depending on the interpretation, that could work too 🙂
With all due respect, every musician in an orchestra is ‘key’.
Then we hold different opinions. I have yet to encounter a business that employs as many employees as orchestras that are devoid of key employees. But if we want to drill down into quantification, you can find what you’re looking for via the existence of individual agreements. The orchestra association as employer is under no obligation to offer them but they most certainly do. Offering musicians individual agreements doesn’t devalue the other members, conversely, it recognizes and rewards the value of musicians that cross this key value threshold.
A great example of this are musicians who don’t hold principal or fixed chair positions yet manage to successfully secure an individual agreement. It demonstrates the employer’s recognition of those contributions it a tangible and meaningful fashion.
I think tradition also come into play. Living in NY, I get to hear all eight almost every season. For my retired professional musician’s ears, Philly is still tops despite being eighth on the current pay-scale. Theirs is a total ensemble mesh of intonation and quality unmatched by any US orchestra, and matched only by Amsterdam from Europe. All including Berlin, Vienna, Bayerische Rundfunk play Carnegie except for the NY and LA Philharmonics.
If you look at compensation through cost-of-living-adjusted figures, the picture is rather different. Chicago is the highest “value” compensation and New York the lowest (2015-16). In order: Chicago, Cleveland, Los Angeles, Philadelphia, Boston, National, San Francisco, New York.
Viewed this way, you might even say there appear to be two tiers: Chicago-Cleveland, and everyone else.
Cost of living gives a clearer picture of what one can buy with one’s salary, but there are still tangible items that could affect the value proposition significantly: are public schools acceptable, is car ownership necessary, how much health insurance is provided, how many members of the orchestra have individual contracts above minimum scale, etc.
This is to say nothing of the intangible elements that affect quality of life and influence decisions. In fact, one might argue that cost of living in some cities is higher because perceived quality of life is higher.
However, the differences in cost of living are so great between some of the cities in the discussion that I think they have a bearing on a basic analysis of salary competitiveness.
Thanks for that Christine, it is a good example why the sort of static cost of living adjustments (COLA) you’re referencing are rarely well suited for competitive style discussions. For instance, in the direct message you sent to me via the contact form, you wrote:
“$128,284 in Cleveland is equivalent to $223,610 in San Francisco, according to the calculator at bankrate.com. That’s a 74% difference in cost of living…but in adjusted terms, the value of the Cleveland salary puts it almost at the top of the US orchestras”
I believe you meant to say that is a 74 percent change in cost of living, the percent difference is 54 percent. Although not uncommon to see them used interchangeably, they have mutually exclusive applications (more info).
Nonetheless, using the 74 percent figure you provided and the notion of adjusted value to determine competitiveness, it would be just as easy to say that Cleveland could reduce base musician compensation by that same percentage and be equally competitive to San Francisco’s current rate.
For perspective, a 74 percent change in base musician compensation at Cleveland would lower that figure $33,353. Would Cleveland be competitive to San Francisco at that starting salary?
This isn’t to discount cost of living adjustments and their influence on overall competitiveness, they are undeniably a variable in the larger equation in similar fashion to the other compensation items I mentioned above.
But with the context of dynamic real-world application, it is ill-advised to make the sorts of static comparisons you are referencing. Consequently, this helps illustrate why those sorts of adjustments are rarely included in this setting so I am grateful that you brought up the topic.
Sorry! Wrong word, indeed.
It would be clearer to say that the cost of living in San Francisco is about 74% higher than in Cleveland. The cost of living in Cleveland is about 43% lower than in San Francisco (according to the cost of living calculator at bankrate.com, whose source is ACCRA costofliving.org).
We’re still off there. Think of this way, percent change is when a time involved whereas percent difference is the absolute value. What you’re looking for in this comparison is the latter. Having said that, it still won’t avoid the numerous bear traps referenced in my previous reply.