When it comes to executive compensation, the 2014/15 season witnessed one key benchmark in the form of the highest ever severance payout to an executive. After filtering out that anomaly, the average executive compensation increased by approximately four percent and you were the only stakeholder group to experience an average increase.
The Information
In order to provide information that is as accurate as possible, info from the 2014/15 season is gathered from the following sources:
- Executive compensation figures were obtained from their respective orchestra’s IRS Form 990 for the 2014/15 concert season.
- Total Expenditures were also obtained from each respective orchestra’s IRS Form 990 for the 2014/15 concert season (due to their relationship within a larger performing arts structure, Total Expenditure figures for National Symphony, Atlanta Symphony, and Dayton Philharmonic are estimates).
Adaptistration makes no claim to the accuracy of information from documents compiled or reported by external sources. If you have reason to believe any of the information is inaccurate or has changed since reported in any of the above sources and you can provide documentation to such effect, please feel free to use the following form to submit a notice.
What The Numbers Don’t Show
It is important to remember that the numbers shown do not always convey a complete compensation picture. For example, an executive director may have had a large increase in salary due to a severance or deferred compensation package owed when the position was vacated. Additionally, the documents used to gather figures do not indicate how much of the season an individual received a salary. As such, the cumulative compensation may artificially inflate annual earnings. Conversely, reported figures may not reflect bonuses or other incentive payments, therefore underreporting what executives may actually earn. As such, the cumulative compensation executives may differ from what is listed.
If you’re curious about exactly how much of a difference can exist, the Philadelphia Orchestra bankruptcy proceeding shed a sliver of light onto the river of unspecified compensation executives can garner by way of perks and benefits. Details were reported in an article published on 3/2/2012.
For additional details about any individual executive’s compensation in any given season, you should review the corresponding IRS Form 990 for any statements, notes, and/or addendums provided by the organization to explain compensation abnormalities.
2014/15 Season Executive Compensation

Top 10 Earners
- Los Angeles Philharmonic: $1,714,486
- Minnesota Orchestra: $1,048,686
- Boston Symphony: $777,296
- Philadelphia Orchestra: $776,143
- New York Philharmonic: $675,984
- Cleveland Orchestra: $629,303
- San Francisco Symphony: $542,638
- Atlanta Symphony: $524,650
- Dallas Symphony: $521,699
- Detroit Symphony: $437,007
Items Of Note
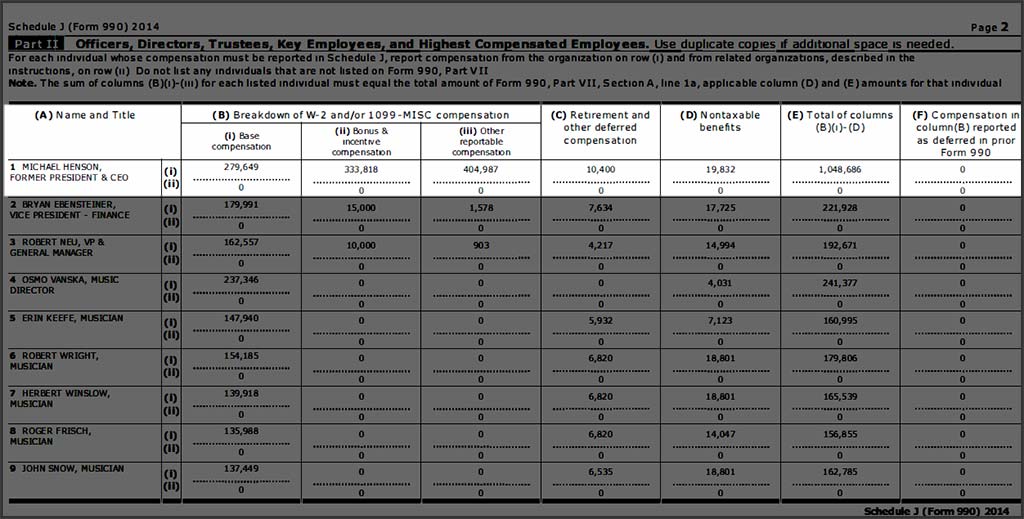
The one item stands out above all others in the form of the Minnesota Orchestra’s 145.35% increase in executive compensation.
For the sake of context, the 2014/15 season is when the organization emerged from its season long work stoppage. In what may perhaps be best described as an internal power struggle between then President & CEO, Michael Henson, and returning Music Director, Osmo Vanska, the latter ended up continuing his tenure. Having said that, the 990 makes it clear that he took a large part of the organization’s annual expenditures with him.
Schedule J, Part II. B.ii. reports $333,818 was paid as “Bonus & Incentive Compensation” while B.iii. reports $404,987 was paid as “Other Reportable Compensation.” This was in addition to his base compensation ($279,649), retirement and other deferred compensation ($10,400), and nontaxable benefits ($19,832). As a result, Henson’s cumulative compensation reached $1,048,686.
Currently, this is the heaviest golden parachute recorded since the reports began in 2005.
Related Posts
-
When it comes to executive compensation, the 2013/14 season was the first in a while where a number of the traditionally highest paying executive…

-
As is the case with every annual orchestra compensation report, the most important element to keep in mind is these figures encompass the 2013/14…

-
As is the case with every annual orchestra compensation report, the most important element to keep in mind is these figures encompass the 2014/15…